GDB is an OK command-line debugger, but its not a solid foundation for graphical debuggers. According to the GDB documentation, the recommended way of interacting with the debugger is through the GDB/MI interface, which offers almost the same functionality as the regular GDB command-line through an alternative text protocol with a well-defined but somewhat obtuse grammar. If all we need is the ability to automate a GDB session, then GDB/MI is probably enough, but if we want our frontend to provide functionality not present in GDB, we may be out of luck.
As an example, let's imagine we want to ask GDB about the value associated to a variable. In a regular command-line debugging session, we would issue a print command specifying the name of the variable and the debugger would look for it inside the blocks encompassing our current line to provide an answer.
What happens, however, when we try to implement mouseover variable inspection? Suddenly, the current line can't act as an implicit location for our queries and the variable we want to inspect may not be uniquely identified by its name. Take for instance this run-of-the-mill piece of C++ code, representative of my coding style on Friday afternoons:
1 2 3 4 5 6 7 8 9 10 11 12 13 14 15 16 17 18 19 20 | int main(void){
float thing = 2.f;
{
int thing = 3;
int lets_break_here = 0;
{
char thing = 'a';
// thing in a comment
#if 0
thing
#endif
}
}
for(int i = 0; i<10; ++i){
thing = thing * thing;
}
return 0;
}
|
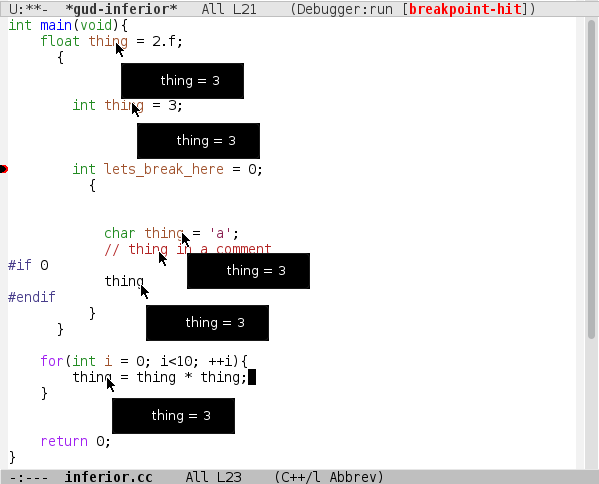
Let's say we decide to stop on line five and inspect the values associated to all available things using Emacs' gud-tooltip-mode.

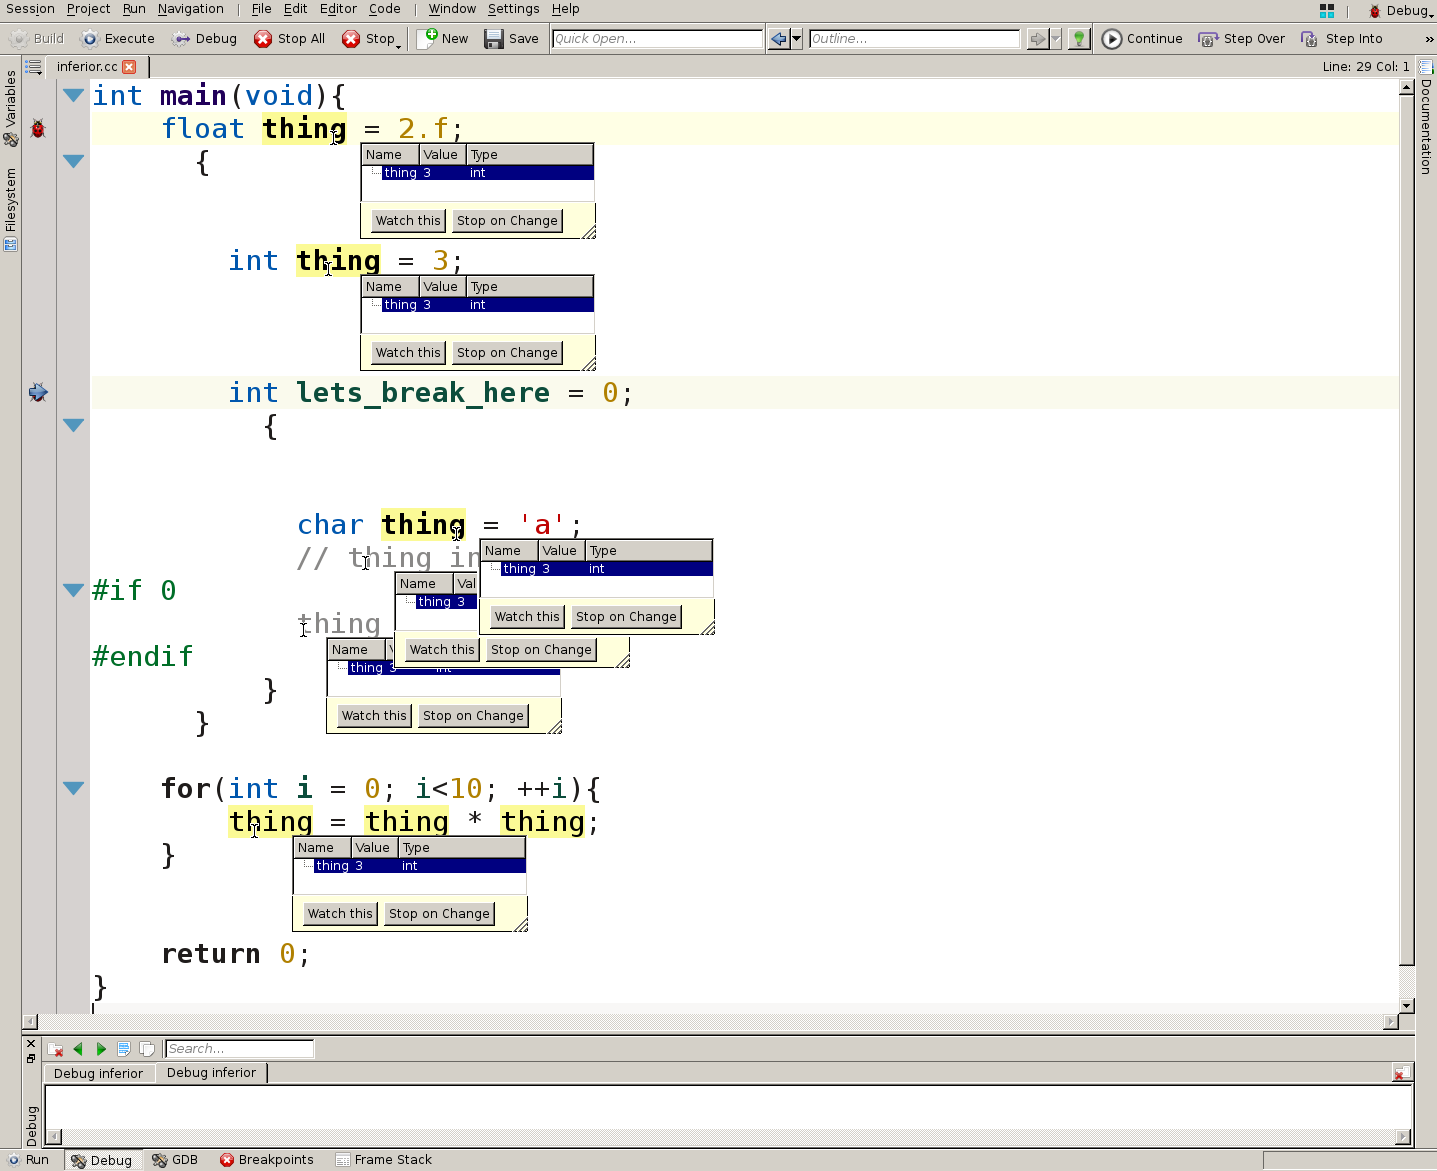
The result are wrong most of the time. Maybe KDevelop has other thoughts on the matter...

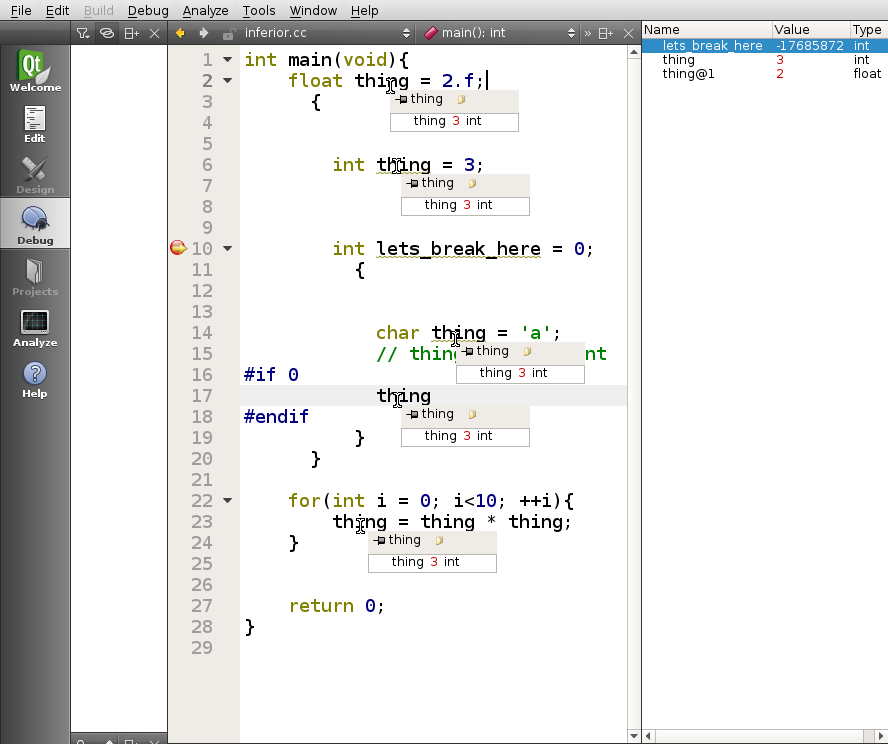
Not really. Qt-creator?

This one at least does not fall for the commented thing and even acknowledges the existence of other types of things somewhere else in the program. But still, I'm beginning to suspect that GDB frontend programmers don't usually debug the sort of code I tend to work on. The results are the same for Eclipse's CDT standalone debugger and for DDD. I can't say what CLion and Nemiver do, because they refuse to work on my machine.
Figuring out the lexical scope of variables in C programs is not that hard. All these frontends fail to implement it properly because GDB makes it hard for them. Sure, they could issue an info scope 7 command and find out the addresses and sizes of all variables relative to the stack base pointer for all scopes encompassing line seven:
Scope for 7:
Symbol thing is a variable at frame base reg $rbp offset 0+-17, length 1.
Symbol thing is a variable at frame base reg $rbp offset 0+-12, length 4.
Symbol lets_break_here is a variable at frame base reg $rbp offset 0+-16, length 4.
Symbol thing is a variable at frame base reg $rbp offset 0+-8, length 4.
Then, they would only need to infer somehow which thing's which, find its type and format its value accordingly. At this point it may be easier to read the DWARF debug information directly and avoid GDB altogether.
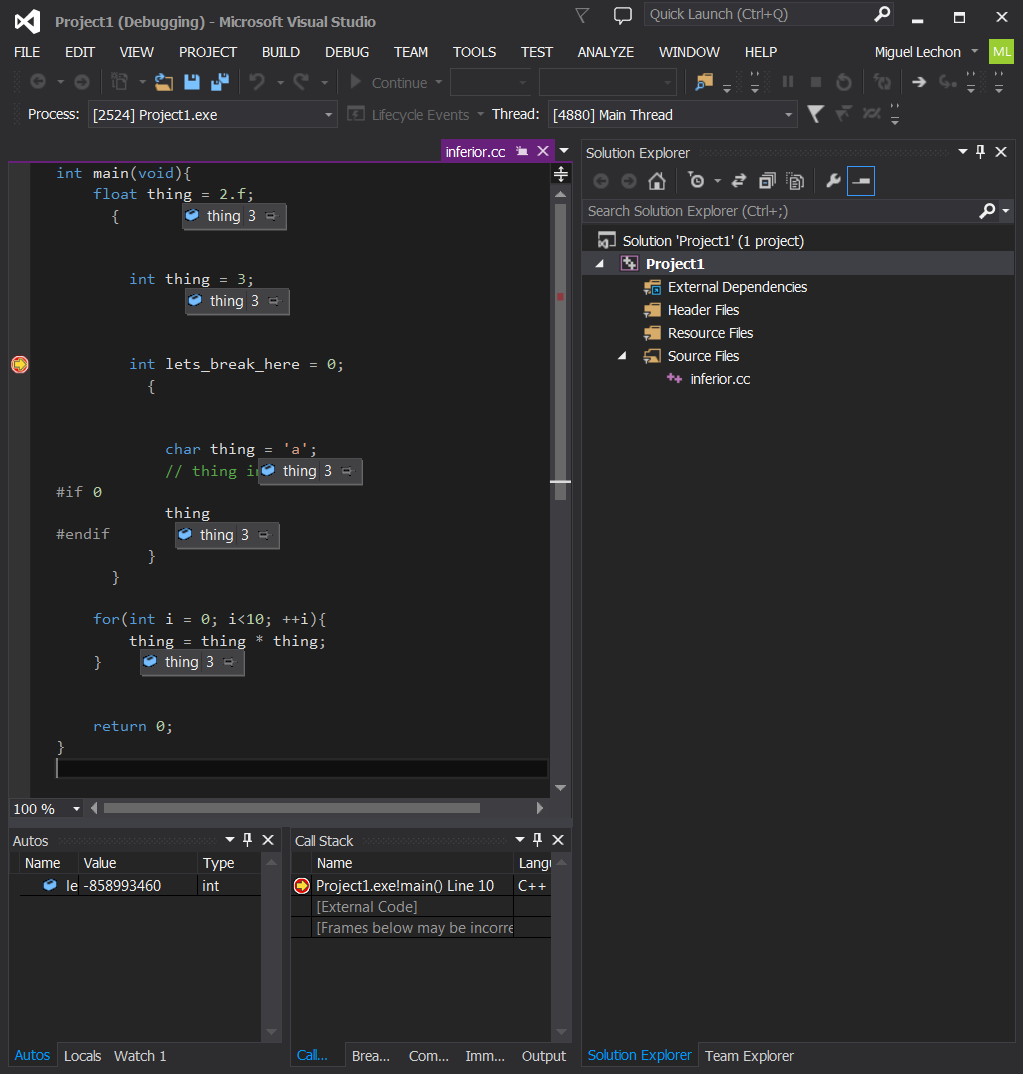
Or we could just purchase a Windows license, download Visual Studio Community Whatever, register it and...

Oops!
I suppose the problem here is that the Visual Studio team cares mostly about C#, and since C# does not allow variables with the same name in nested scopes...